✓ SubscribeSubscribers: 320
 RG Analitics 🟢 [PRIVATE CHANNEL🔒]
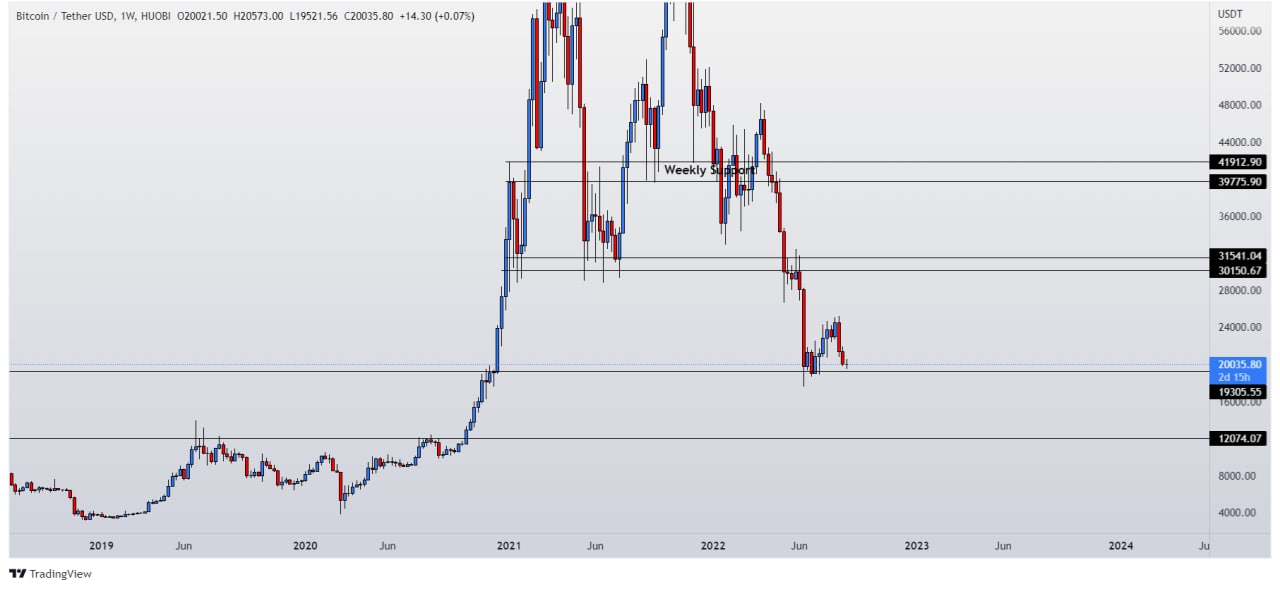
#Bitcoin Monthly candle close done ✅ and price left out the small wick to the downside, which open the gates for a potential next monthly candle bearish. This is a weekly TF chart where price is lying on a major support zone and previous Bull Run High too, which might be broken for liquidity grab.
Note : This is a weekly and Monthly chart, so things will not happen overnight. In lower TF, you may get high probable setups. 📈
Note : This is a weekly and Monthly chart, so things will not happen overnight. In lower TF, you may get high probable setups. 📈