✓ SubscribeSubscribers: 264
 RG Analitics 🟢 [PRIVATE CHANNEL🔒]
Educational Post:
What is Bollinger Bands?
Bollinger Bands are a technical analysis tool for trading developed by John Bollinger in the 1980s. The bands are part of a volatility indicator that calculates the relative high and low of a security’s price in relation to previous trades.
Volatility is measured using standard deviation, which changes as volatility rises or falls. When the price rises, the bands widen, and when the price falls, the bands narrow. Bollinger Bands can be used to trade various securities due to their dynamic nature.
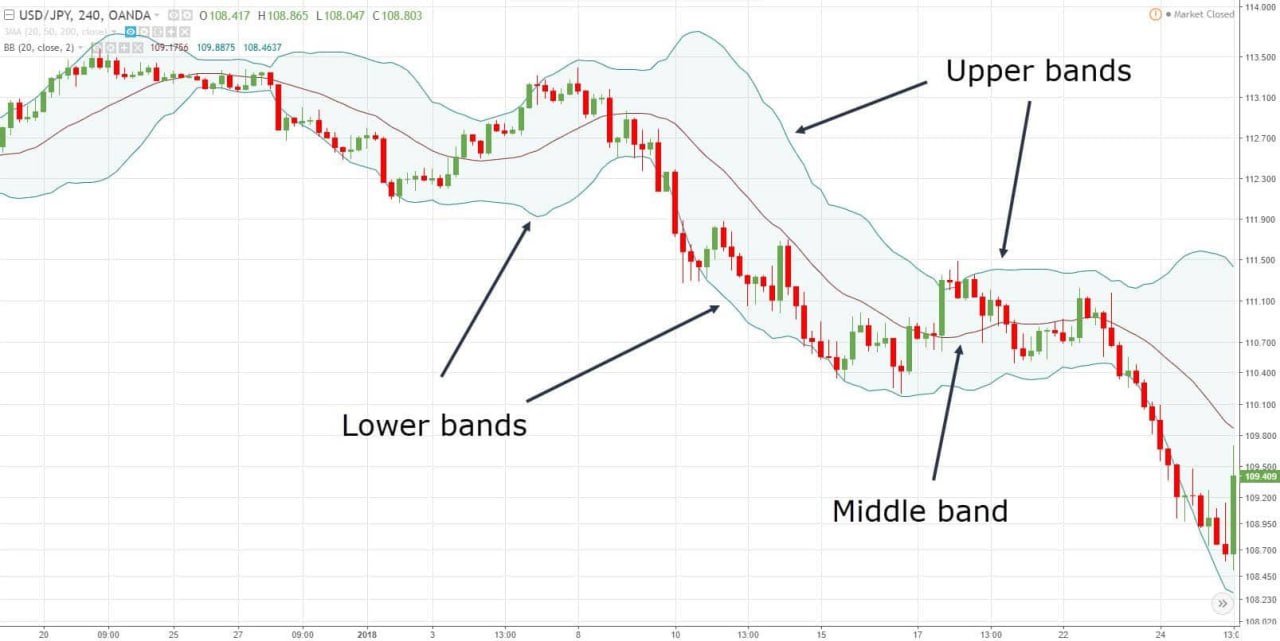
Bollinger Bands are made up of three lines: upper, middle, and lower. The middle band is a moving average, and the trader determines its parameters. The upper and lower bands are on opposite sides of the moving average band. Price usually moves between the upper and lower line of Bollinger Bands (BB).
What is Bollinger Bands?
Bollinger Bands are a technical analysis tool for trading developed by John Bollinger in the 1980s. The bands are part of a volatility indicator that calculates the relative high and low of a security’s price in relation to previous trades.
Volatility is measured using standard deviation, which changes as volatility rises or falls. When the price rises, the bands widen, and when the price falls, the bands narrow. Bollinger Bands can be used to trade various securities due to their dynamic nature.
Bollinger Bands are made up of three lines: upper, middle, and lower. The middle band is a moving average, and the trader determines its parameters. The upper and lower bands are on opposite sides of the moving average band. Price usually moves between the upper and lower line of Bollinger Bands (BB).